Project management application Design
About Project
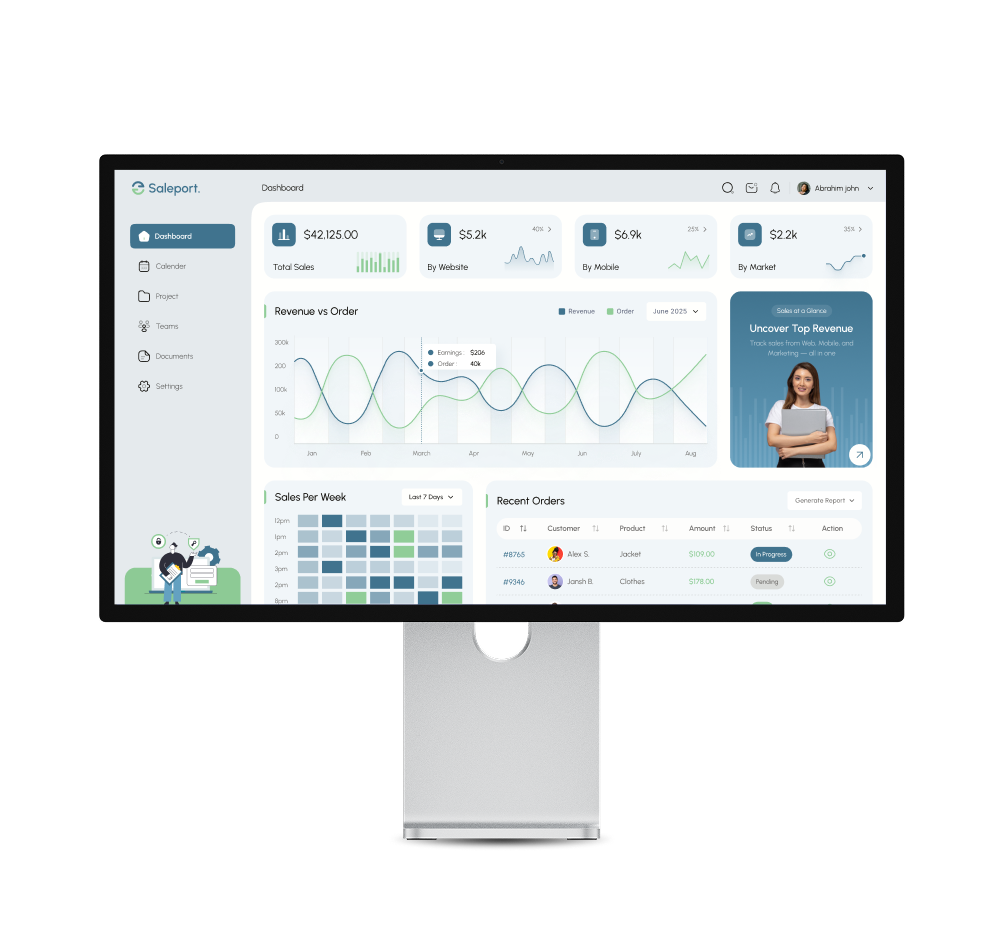
The interface focuses on clarity and usability, featuring intuitive data visualizations like revenue graphs, weekly sales heatmaps, and real-time order tracking. With actionable insights and a streamlined layout, Saleport enables teams to make faster, data-driven decisions and uncover growth opportunities effortlessly.
Problem Statement
Our Solution
Problem & Solution
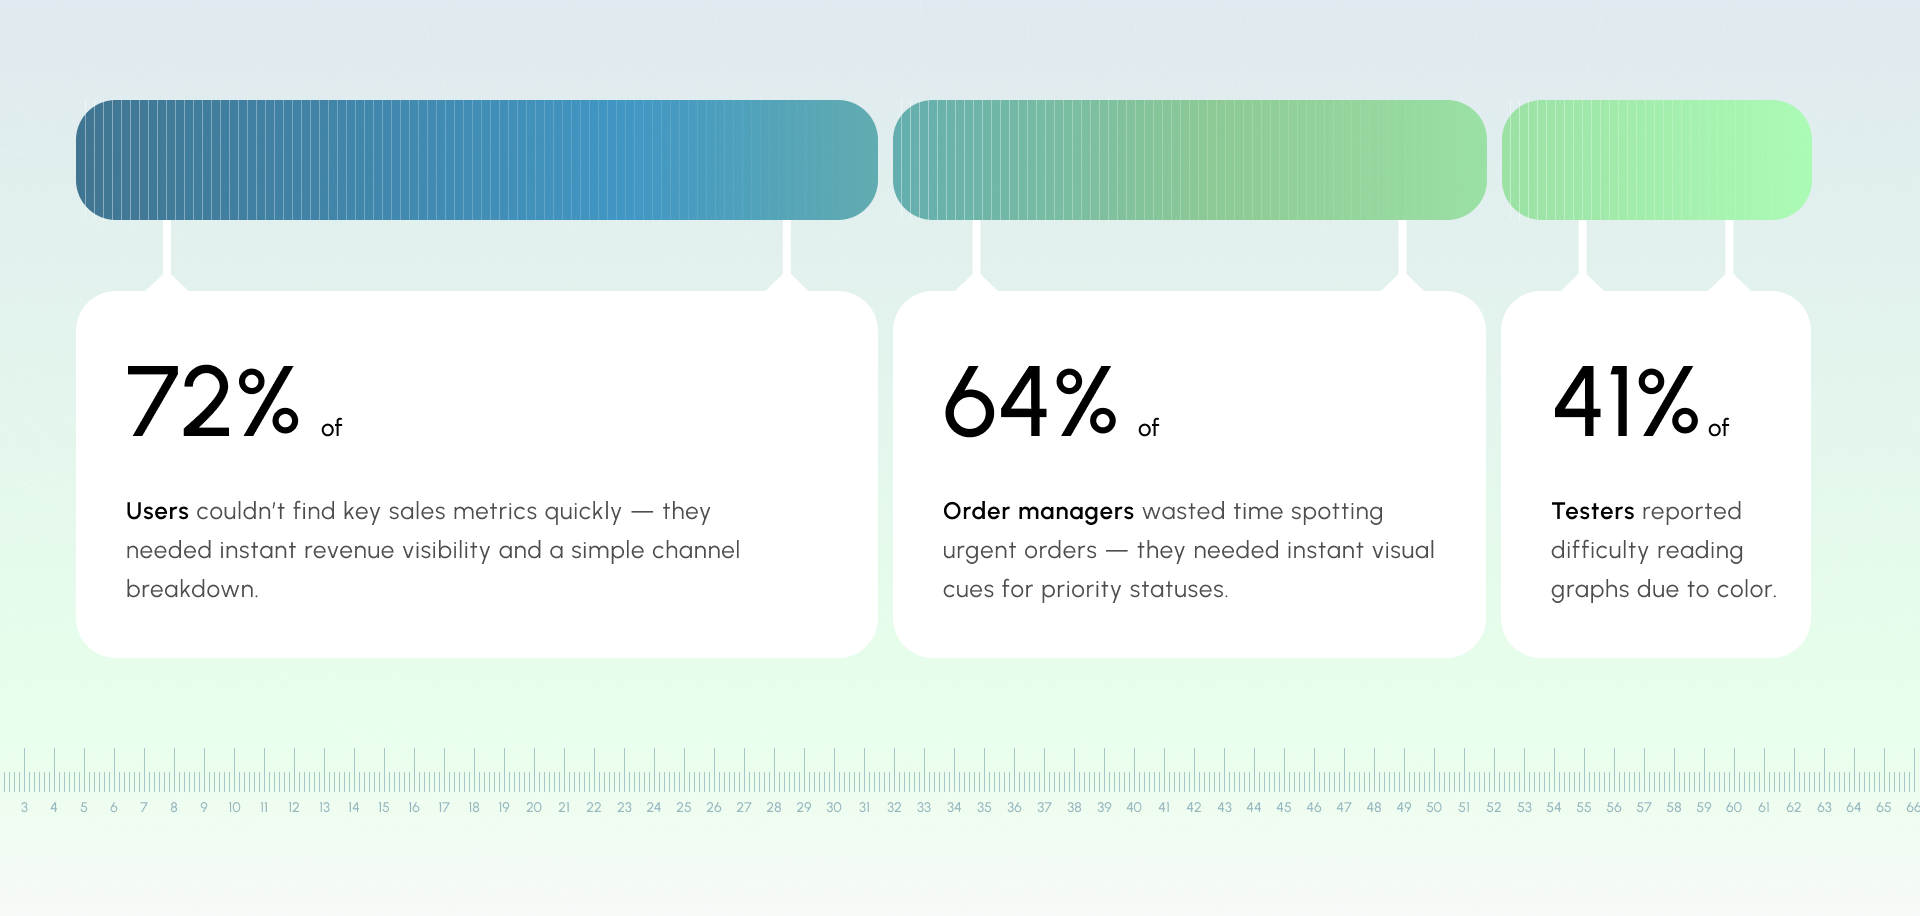
Businesses struggled to manage sales performance across multiple platforms, spreadsheets, and reporting tools. This made it difficult to monitor growth, identify trends, and make fast business decisions with confidence.
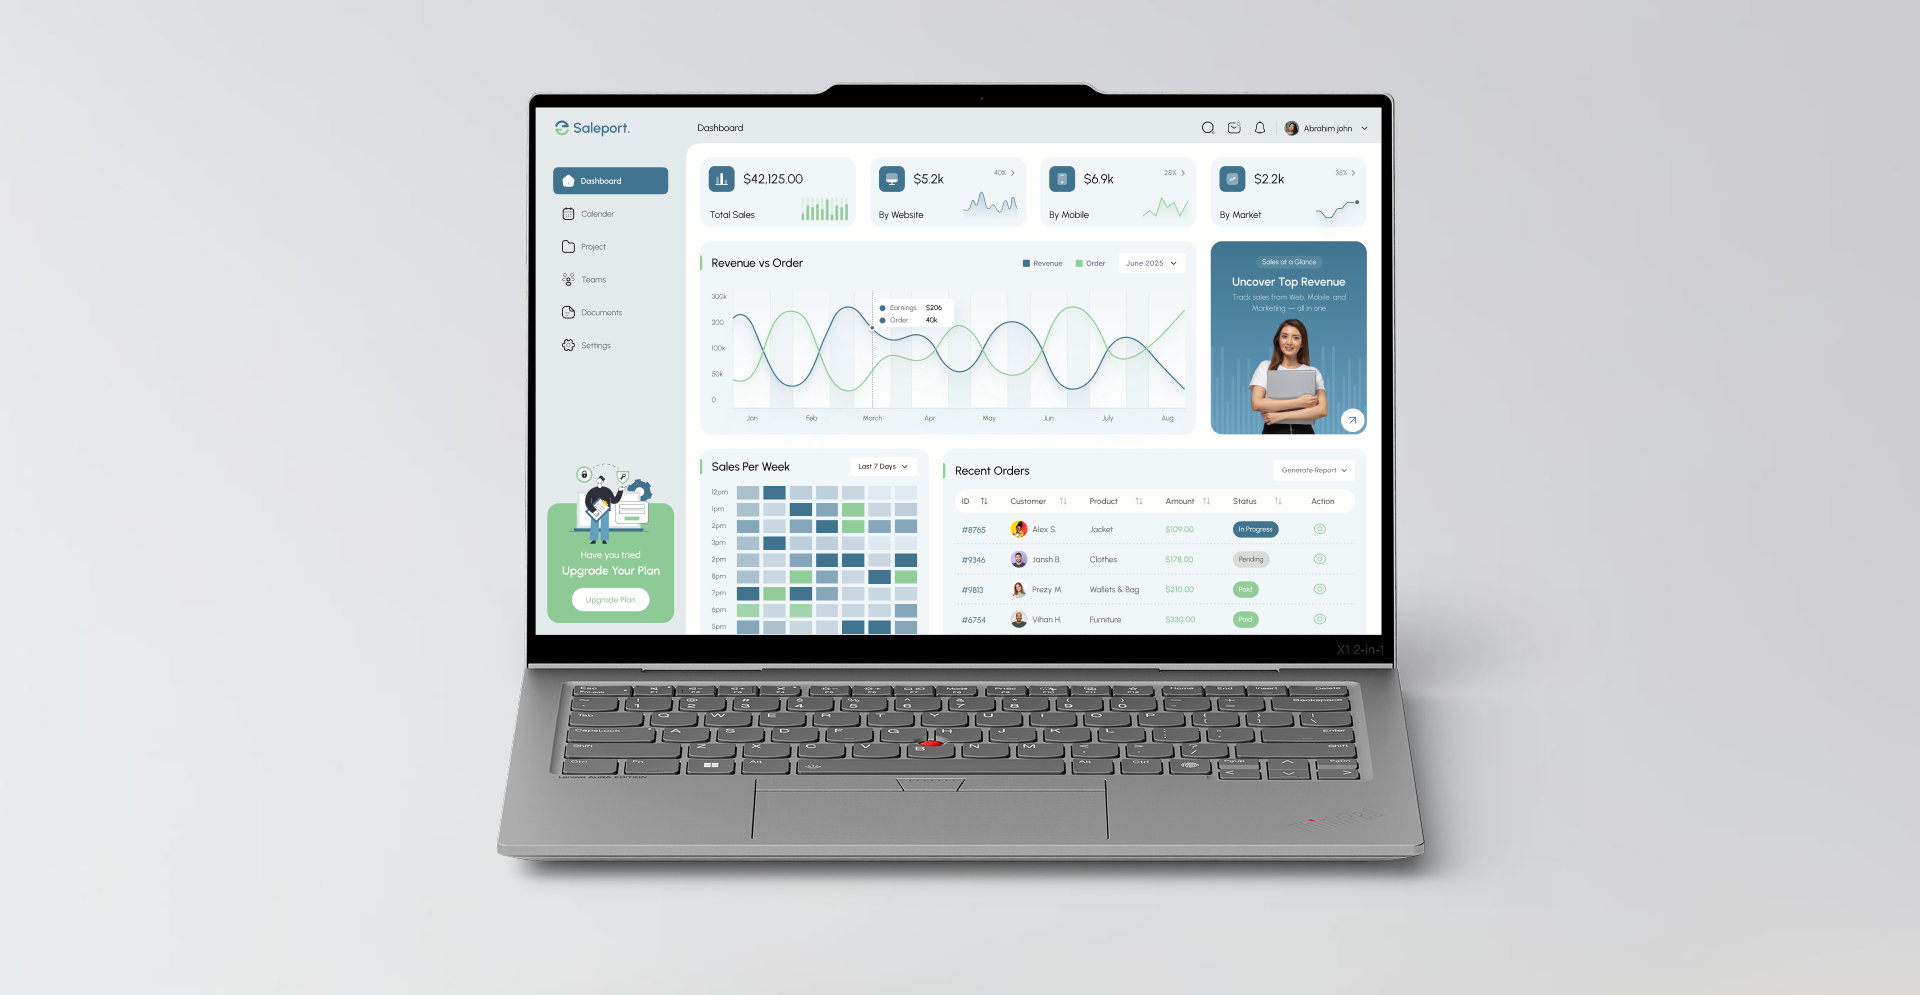
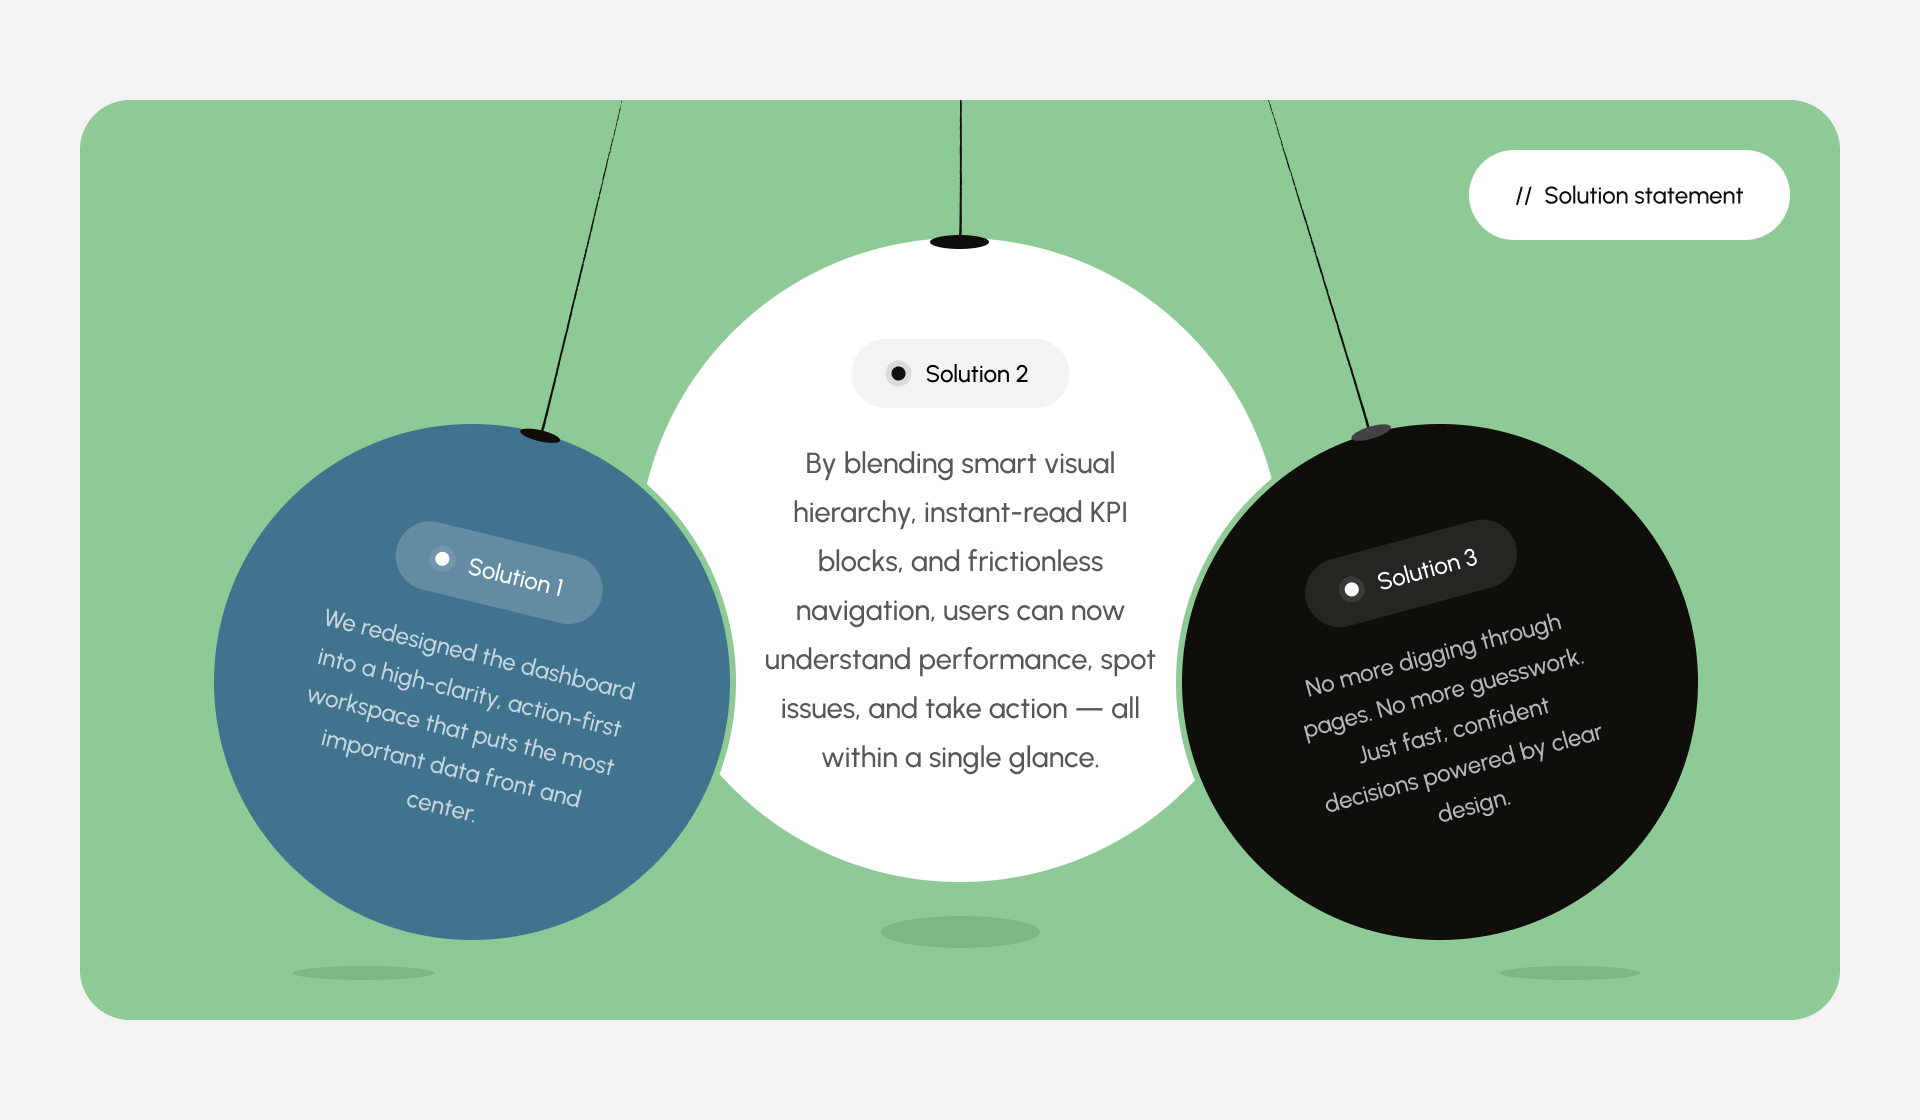
We designed a centralized dashboard that brings all key sales metrics into one place, helping users track performance, monitor reports, and access real-time insights easily.
Many existing dashboard systems felt cluttered and overly technical, creating a frustrating experience for teams trying to quickly understand their data and daily performance.
We created a clean and modern dashboard with simple navigation, clear data visualization, and organized layouts for a smoother user experience.
Teams faced communication delays and disconnected workflows due to scattered reporting systems and limited collaboration visibility across departments and sales operations.
We introduced collaboration-focused workflow tools that improve communication, simplify reporting, and help teams stay aligned with shared updates, tasks, and real-time performance tracking.
Userflows
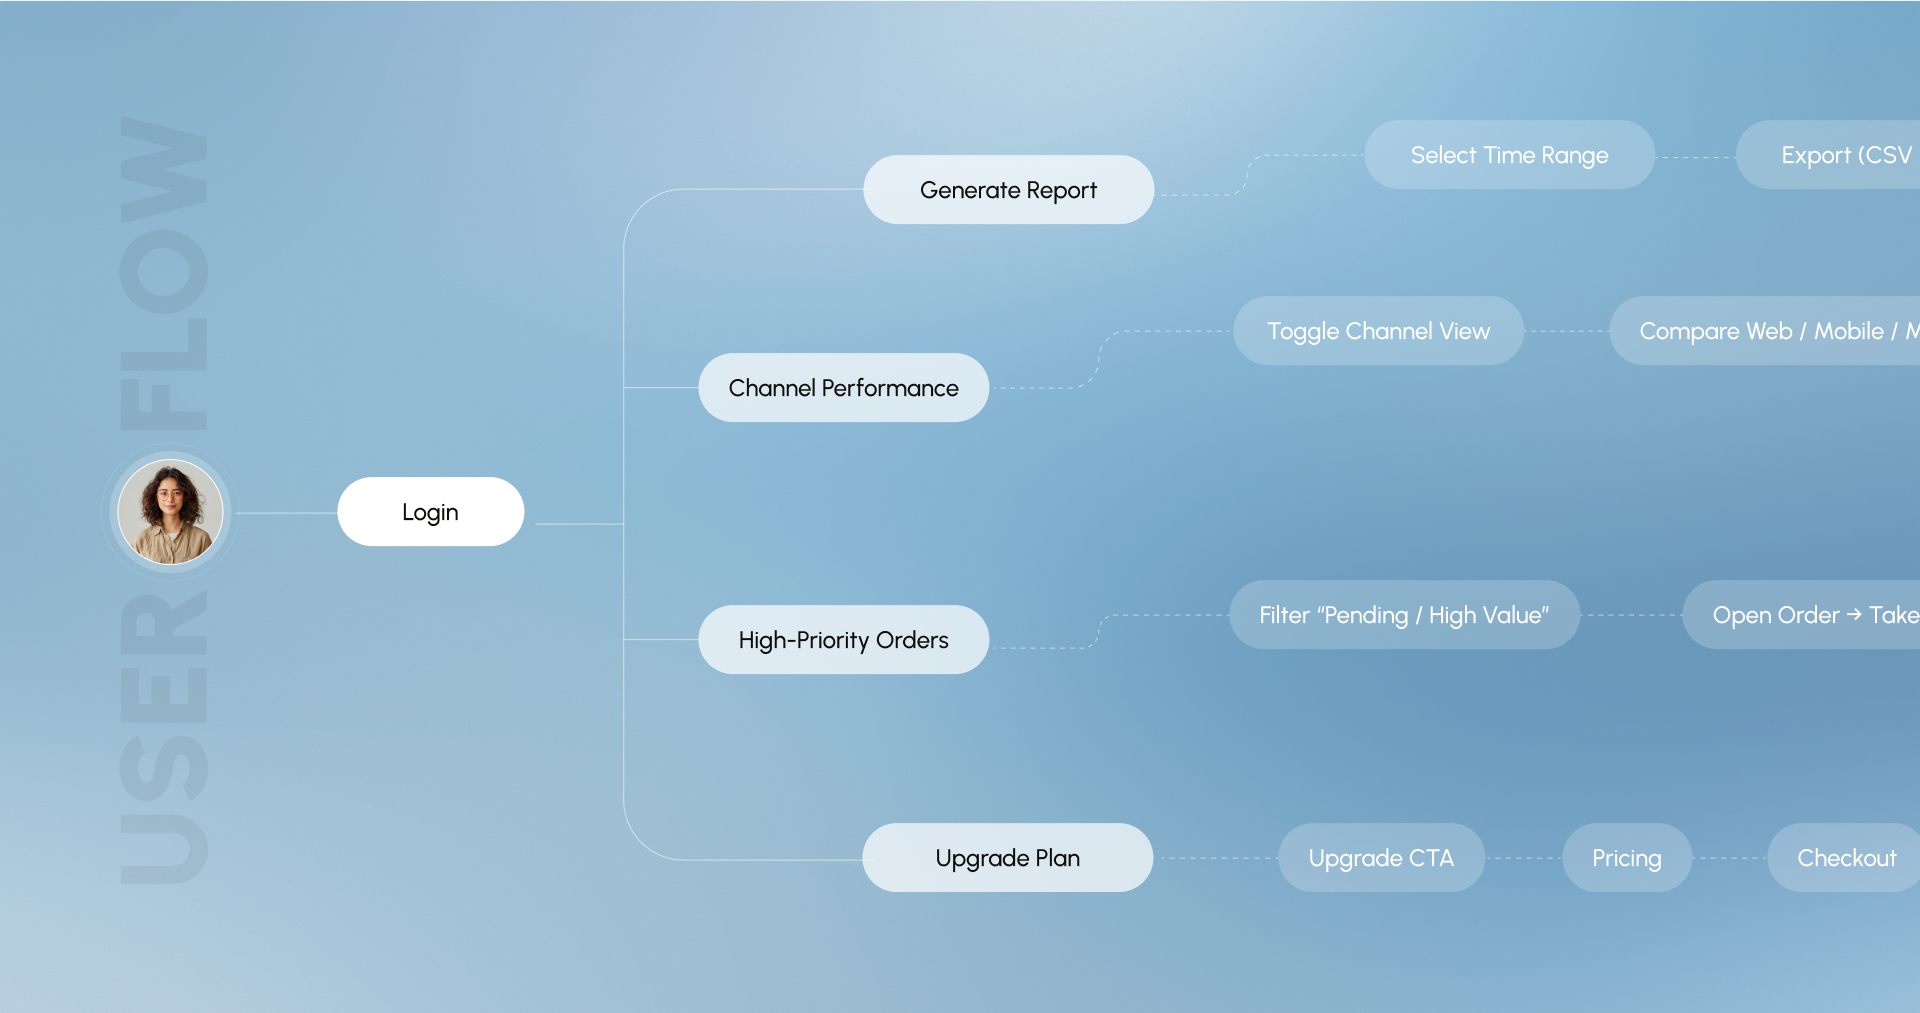
User Research
performance tracking, and simplified reporting workflows.
Dashboard Interface Preview
clear data visualization, and an intuitive user experience.
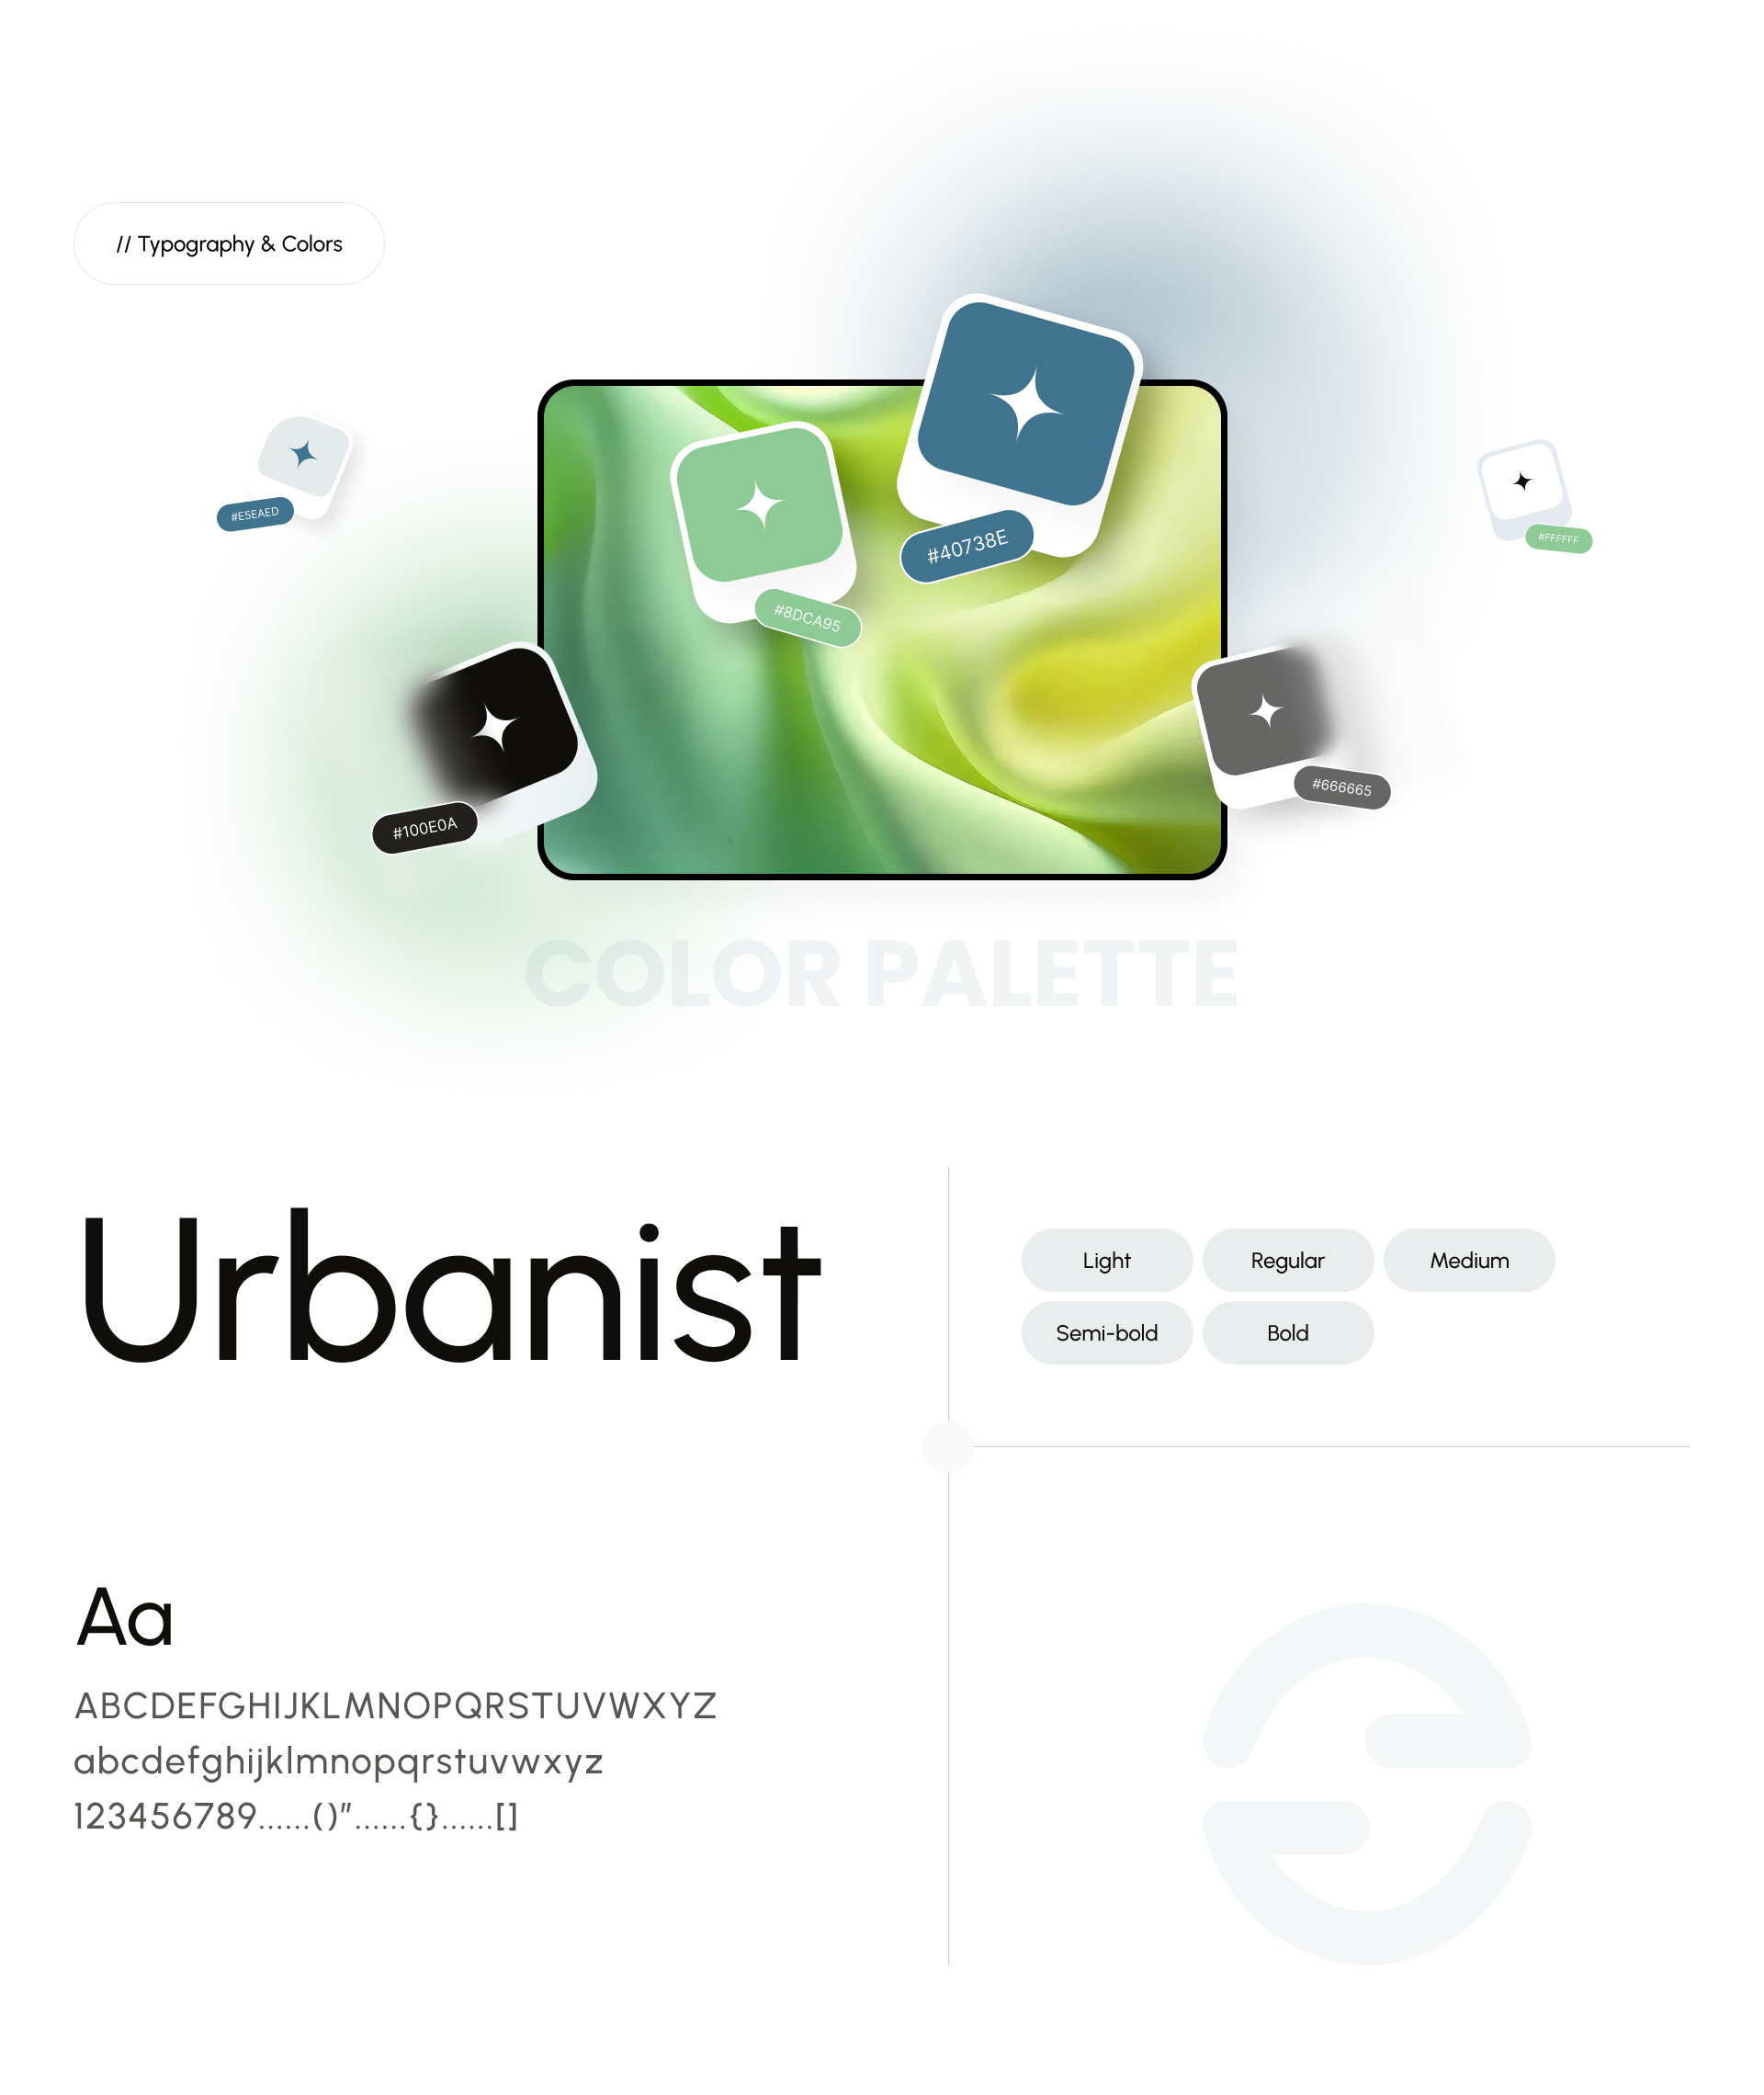
Typography Colors Dashboard Interface Preview
ensuring readability, accessibility, and a professional look.
Solution Approach
Outcomes & Metrics
Sales tracking became easier through a centralized dashboard that brings revenue, orders, and performance insights into one place.
Live data updates surfaced key trends faster. User confidence in decision-making increased.
Simplified navigation and clear data visualization reduced time to analyze reports and monitor performance.
Supports faster analysis and better decision-making through clear, data-driven dashboard experiences.


